Read the story, then explore: change teams or seasons in the charts. Team logos identify the comparisons. In health comparisons, red ↑ means more injury burden; teal ↓ means less. Report shares and timing use higher/lower labels without judging health. Tap a dotted term for its definition. The methods and full data are at the end.
Yes, the 49ers have carried an unusually heavy burden.
Every fan can assemble a painful list of injured players. The harder question is whether that list represents something unusual across the league. For San Francisco, the answer is yes—with an important distinction between consistently near the worst and uniquely different from everyone else.
We use Football Outsiders and FTN’s , or AGL. It estimates regular-season availability lost to injuries among expected starters and important contributors, including fractional losses for playing while listed as injured. It is a burden measure, not a count of new diagnoses, and it does not give an All-Pro more weight than an ordinary starter. FTN explains the metric.
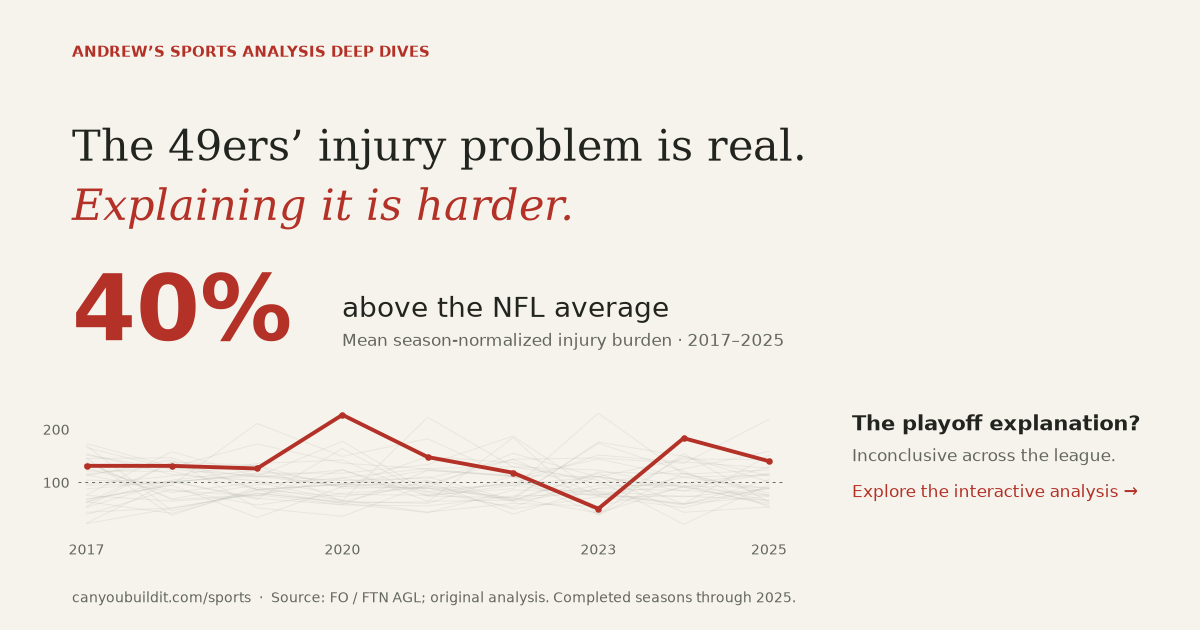
To compare years, each season’s NFL average becomes 100. An of 140 means 40% more burden than that season’s league average. San Francisco’s average index across 2017–2025 is 139.6, the highest of the 32 franchises, narrowly ahead of Arizona’s 138.3. The 49ers finished among the ten most injured teams in eight of nine seasons.
Where each team sits in the injury table
Injury burden relative to that season’s league. Higher is worse; 100 is the NFL average.

Swipe to explore the full chart →
View the data
| Season | Team | Adjusted games lost | Injury index | Healthiest rank |
|---|---|---|---|---|
| 2017 | San Francisco 49ers | 91.6 | 131.3 | 23 |
| 2018 | San Francisco 49ers | 97.2 | 131.2 | 26 |
| 2019 | San Francisco 49ers | 95.8 | 126.3 | 27 |
| 2020 | San Francisco 49ers | 161.6 | 227.4 | 32 |
| 2021 | San Francisco 49ers | 119.5 | 147.8 | 29 |
| 2022 | San Francisco 49ers | 93.9 | 118.4 | 24 |
| 2023 | San Francisco 49ers | 34.5 | 50.4 | 4 |
| 2024 | San Francisco 49ers | 141.2 | 183.5 | 32 |
| 2025 | San Francisco 49ers | 115.0 | 140.1 | 28 |
This is not just the extraordinary 2020 season inflating the total. Remove both 2020 and 2021 and SF still ranks fourth, about 26% above average. Remove 2017, the oldest methodology vintage in our compilation, and SF still ranks first.
That makes the 49ers one of the league’s most persistently injured teams. It does not put them on an island: Arizona is close, and several franchises have also endured long stretches of poor health. Even a conventional statistical check stops short of calling SF a lone outlier. “Unusually bad, unusually often” fits the evidence better than “something no other team experiences.”
More knees and calf problems. Not more of everything.
“Injuries” bundles together very different football problems. A knee on the weekly report, a recurring hamstring strain and a concussion do not point to the same explanation. Is San Francisco’s mix different?
There is a pattern worth noticing. Knees account for 23.9% of the 49ers’ injury-report mix, versus 18.9% for comparable reports elsewhere. Calf and Achilles conditions make up 6.8%, versus 4.1%. Hamstrings go the other way: 8.2%, against 9.9%. The comparison adjusts the other teams to the 49ers’ mix of seasons and listed positions, so a different balance of linemen and receivers does not alone drive the result.
The key phrase is . A listing that names two body regions is split evenly between them. One knee problem that lingers for six weeks can appear six times. A player sent straight to injured reserve may disappear from this dataset. And “knee” does not tell us whether the diagnosis was soreness, a sprain or a torn ACL. This chart describes the problems appearing on public reports, rather than every injury the team suffered.
What appears on injury reports?
Compare the mix of body regions mentioned, not how often players get hurt. One lingering problem can appear in several weeks; players sent directly to injured reserve may be missing.
means the percentage of physical report-listing weight assigned to a body region. A knee-and-ankle listing gives half a unit to each, so the categories add to 100%.
The other 31 comparison is matched by season and listed position: it shows what the rest of the league’s mix would look like with this team’s mix of seasons and player positions.
Higher or lower describes the share of reports, not a better or worse injury rate.
Swipe to explore the full chart →
Difference whiskers are approximate simultaneous 95% uncertainty ranges across all 11 categories. Every range includes zero. Choose Differences to see those ranges.
How this comparison works
Each listed player contributes one unit per game report. Different body regions on the same listing split that unit equally. Repeated weekly reports still contribute repeatedly, so a region’s share can reflect how long problems linger and how teams report them.
The other 31 teams are reweighted to match the selected team’s distribution of listed positions within each season. This compares the composition of reports conditional on being listed; it does not estimate risk per player, snap or game.
For San Francisco over 2017–2025, uncertainty was estimated by resampling SF player histories and other franchises 4,000 times. The displayed ranges allow for examining all 11 categories together. None excludes zero. Other team/year selections show point estimates without uncertainty ranges.
“Knee” cannot distinguish a torn ACL from soreness. “Calf / Achilles” does not establish an Achilles rupture. “Concussion-related” includes evaluation, clearance and protocol mentions, not just confirmed concussions. “Other physical condition” includes specified remaining regions and conditions such as ribs, quadriceps, abdomen and dehydration; it is not a bucket of guessed vague entries.
View the data for San Francisco 49ers, 2017–2025
| Body region / condition | Weighted listings | Physical player-game listings | Team share | Matched other 31 share | Difference (pp) | Simultaneous 95% lower | Simultaneous 95% upper |
|---|---|---|---|---|---|---|---|
| Knee | 323.5 | 1,354 | 23.9% | 18.9% | +5.0 | -2.7 | +12.6 |
| Ankle | 213.5 | 1,354 | 15.8% | 14.6% | +1.2 | -4.6 | +7.1 |
| Hamstring | 111.5 | 1,354 | 8.2% | 9.9% | -1.6 | -5.2 | +2.0 |
| Shoulder | 93.5 | 1,354 | 6.9% | 9.2% | -2.3 | -6.2 | +1.5 |
| Concussion-related | 61.0 | 1,354 | 4.5% | 5.2% | -0.7 | -3.1 | +1.7 |
| Foot / toe | 75.5 | 1,354 | 5.6% | 7.0% | -1.4 | -5.5 | +2.6 |
| Calf / Achilles | 91.5 | 1,354 | 6.8% | 4.1% | +2.7 | -1.8 | +7.1 |
| Back / neck | 54.0 | 1,354 | 4.0% | 6.4% | -2.4 | -5.0 | +0.2 |
| Hip / groin | 95.0 | 1,354 | 7.0% | 8.0% | -1.0 | -4.7 | +2.7 |
| Arm / hand | 98.5 | 1,354 | 7.3% | 7.7% | -0.4 | -4.1 | +3.2 |
| Other physical condition | 136.5 | 1,354 | 10.1% | 9.0% | +1.1 | -2.9 | +5.1 |
The knee tilt is remarkably consistent: SF sits above its adjusted comparison in all nine seasons. It also survives an age adjustment and a check that reduces repeated weekly listings. Calf and Achilles reports are more uneven, with particularly large gaps in 2018, 2021 and 2024.
Still, a persistent pattern is not automatically a settled finding. Once we account for repeated reports from the same players and the fact that we searched across 11 categories, the estimates remain too uncertain to confidently rule out no difference. The useful lead is knees and calf/Achilles conditions—not a proven, team-specific syndrome.
Nor does this support the broad claim that the 49ers simply have “more soft-tissue injuries.” Their hamstring share is lower. Because these are shares of a total, that does not establish a lower hamstring injury rate, either. Medical diagnoses and time spent at risk would be needed for that answer.
Does playing into February send a bill the next season?
The sequence is compelling. After the 2023 Super Bowl run, San Francisco went from an injury index of about 50 to 183 in 2024. After the 2019 trip, its 2020 index reached 227. Extra games add exposure, and a February finish shortens the calendar gap before the next season. Wear and tear is a plausible hypothesis.
We tested it across 256 team-season transitions: all 32 teams’ 2017–2024 workloads followed by their 2018–2025 regular-season injury burden. January and February games stay with their NFL season: the Super Bowl played in February 2024 is part of the 2023 exposure.
Start with the unadjusted comparison. Super Bowl participants averaged 71 during their run, then 106 the following season. That is a striking jump—but the starting point was exceptionally healthy.
Healthy runs, more ordinary follow-ups
Average injury burden by the previous season’s playoff finish. Index 100 = NFL average; lower is healthier.
↓ Less burden than the run year · ↑ More burden than the run year
Swipe the chart horizontally to see the full comparison →
View data and uncertainty
| Previous season’s finish | Follow-ups | During run | Next season | Change from run year | Next-season mean 95% CI |
|---|---|---|---|---|---|
| Missed playoffs | 150 | 109.8 | 102.9 | ↓ 7.0 pts less burden | 95.1 to 110.2 |
| Wild card exit | 42 | 90.2 | 94.0 | ↑ 3.8 pts more burden | 85.9 to 103.2 |
| Divisional exit | 32 | 91.7 | 99.0 | ↑ 7.3 pts more burden | 87.2 to 110.5 |
| Conference runner-up | 16 | 79.0 | 84.8 | ↑ 5.8 pts more burden | 69.0 to 102.3 |
| Super Bowl | 16 | 71.2 | 106.1 | ↑ 34.9 pts more burden | 75.1 to 153.0 |
Good health helps a team get to February in the first place. A remarkably healthy season is also hard to repeat. Some of that apparent “hangover” may therefore be the return from unusually good luck to ordinary health. The jump alone cannot separate that from accumulated wear and tear. A five-season NFL study likewise found playoff qualifiers healthier in the same season, but did not test next-year carryover.
We then compared teams after accounting for their previous health, winning percentage, and season. Each additional playoff game lined up with about 3.5 extra injury-index points the next year. But the stretches from a small improvement to a meaningful worsening. The data cannot pin down a reliable playoff penalty.
Did heavier usage the year before predict worse health? Not clearly. Counting all offensive and defensive , including the playoffs, did not produce a clear next-year relationship either. That leaves the fatigue hypothesis unresolved. These estimates are too imprecise to dismiss a meaningful effect.
The estimates remain uncertain
Adjusted differences in next-season injury-index points. Every 95% confidence interval includes zero.
Direction remains uncertain: every range extends into both less and more injury burden.
Swipe the chart horizontally to see the full comparison →
View estimates and model uncertainty
| Previous-season exposure | Estimate | 95% CI | Clustered p-value | Wild-bootstrap p-value |
|---|---|---|---|---|
| One more playoff game | +3.5 | −3.4 to +10.3 | 0.315 | 0.324 |
| Reaching the Super Bowl | +17.6 | −21.6 to +56.7 | 0.367 | 0.462 |
| 1,000 more player snaps | +0.1 | −3.7 to +4.0 | 0.940 | 0.942 |
The Super Bowl-only comparison is even less certain. There are just 16 follow-up seasons from seven franchises, with the same successful teams returning again and again. That is a thin foundation for a universal claim.
Those individual seasons reveal why the 49ers feel different.
The 49ers’ Super Bowl follow-ups stand out
All 16 follow-up seasons after the 2017–2024 Super Bowls, ranked by next-season injury burden. Index 100 = NFL average.
Dot colors compare with the NFL average.
Swipe the chart horizontally to see the full comparison →
Injury index 50.4 → 183.5: ↑ 133.1 pts more burden than the Super Bowl season. The team played 3 postseason games; the following regular season recorded 141.2 adjusted games lost.
View all 16 follow-up seasons
| Team | Super Bowl season | Following season | Run-year index | Next-year index | Change | Postseason games |
|---|---|---|---|---|---|---|
| SF | 2019 | 2020 | 126.3 | 227.4 | ↑ 101.1 pts more burden | 3 |
| LAR | 2021 | 2022 | 63.4 | 184.8 | ↑ 121.3 pts more burden | 4 |
| SF | 2023 | 2024 | 50.4 | 183.5 | ↑ 133.1 pts more burden | 3 |
| PHI | 2017 | 2018 | 76.7 | 158.0 | ↑ 81.3 pts more burden | 3 |
| NE | 2018 | 2019 | 101.5 | 112.1 | ↑ 10.5 pts more burden | 3 |
| PHI | 2022 | 2023 | 53.4 | 111.7 | ↑ 58.3 pts more burden | 3 |
| NE | 2017 | 2018 | 87.9 | 101.5 | ↑ 13.7 pts more burden | 3 |
| TB | 2020 | 2021 | 36.0 | 96.8 | ↑ 60.8 pts more burden | 4 |
| KC | 2023 | 2024 | 55.4 | 91.5 | ↑ 36.1 pts more burden | 4 |
| LAR | 2018 | 2019 | 51.2 | 79.9 | ↑ 28.7 pts more burden | 3 |
| CIN | 2021 | 2022 | 74.5 | 71.1 | ↓ 3.4 pts less burden | 4 |
| KC | 2019 | 2020 | 99.9 | 66.4 | ↓ 33.5 pts less burden | 3 |
| KC | 2024 | 2025 | 91.5 | 60.2 | ↓ 31.3 pts less burden | 3 |
| KC | 2022 | 2023 | 60.6 | 55.4 | ↓ 5.3 pts less burden | 3 |
| PHI | 2024 | 2025 | 43.8 | 53.6 | ↑ 9.8 pts more burden | 4 |
| KC | 2020 | 2021 | 66.4 | 44.0 | ↓ 22.4 pts less burden | 3 |


SF’s 2020 and 2024 seasons rank worst and third-worst among the 16 Super Bowl follow-ups. The 2022 Rams sit between them. The other 14 averaged 91.9—slightly healthier than the league. The 49ers belong in the full analysis, of course. Looking at the others simply shows how much those two SF seasons shape the impression of a universal hangover.
Kansas City reached the very same final games. Its subsequent injury indexes were 66.4 in 2020 and 91.5 in 2024. That does not mean winning protects a team. It means reaching the same game was insufficient to produce the same health outcome.
What about repeated deep runs? After three straight conference-championship appearances, eight follow-up seasons averaged 88.6. SF’s 2024 was the worst of those eight. Only three franchises contribute those observations, so this is useful context rather than a decisive test of accumulated fatigue.
A 49ers-like profile exists. Its injury outcome is far from inevitable.
Perhaps no single factor matters as much as the combination: older players, a familiar core, concentrated playing time and repeated playoff trips. We looked for using six traits measured before the injury season: the age of the players doing the work, how established the roster was, how much playing time went to the core, regular-season game volume, recent playoff history and rushing share.
The groups were built without knowing the teams’ names or how injured they would become. That lets us ask a fair question: do teams built like the 49ers tend to suffer like the 49ers?
Two broad profiles emerged. The “established contenders” were older, had more familiar contributors and had played more postseason football. SF entering 2024 fits that description. The groups overlap considerably, though; they are useful sketches of rosters, not two cleanly separated species of NFL team.
How similar teams fared
Choose a season and team to explore broad roster profiles, then compare the five closest teams in all six measured attributes.
Swipe to explore the full chart →
This projection retains 53.4% of feature variation. The grouping has weak separation (silhouette 0.181); distances on this map are not the distances used to select peers.
Compare the two group profiles
Established contenders tend to be older, more continuous, and have greater recent playoff exposure; regular-season playing volume is almost identical. These are pooled descriptive means across all 256 team-seasons, not injury-risk importance scores.
| Attribute | Less established rosters | Established contenders |
|---|---|---|
| Team-seasons in group | 132 | 124 |
| Snap-weighted age (years) | 26.46 | 26.96 |
| Roster continuity | 60.5% | 74.8% |
| Regular-player concentration | 70.9% | 74.0% |
| Regular-season playing volume (player snaps / game) | 1,457.2 | 1,458.0 |
| Recent playoff exposure (games / 3 years) | 0.95 | 3.63 |
| Offensive run share | 41.5% | 43.0% |
| Following-season injury index (100 = NFL average) | 102.7 | 97.2 |
The following-season injury index was excluded from grouping. The difference in health between the two groups is not statistically clear.
What the team looked like entering 2024
Percentiles among 32 teams that year. Values describe 2023, except playoff exposure, which covers the preceding three seasons. Higher percentile means more of that attribute, not more injury risk.
gives more weight to players who played more. asks how much of the previous season’s playing time came from players already on that team a year earlier. is the share handled by its 22 most-used players.
A means one player taking part in one play: an ordinary offensive play contributes about 11 player-snaps. Playing volume adds offense and defense. is the percentage of offensive plays recorded as runs, including quarterback scrambles and kneel-downs.
What these attributes mean
- Snap-weighted age
- Prior regular-season age on September 1 weighted by offensive plus defensive player snaps.
- Roster continuity
- Prior-season share of snaps played by players also active for the same club one season earlier; not current-season roster retention.
- Regular-player concentration
- Prior regular-season share of offensive plus defensive snaps played by the 22 most-used players.
- Regular-season playing volume
- Prior regular-season offensive plus defensive player snaps divided by regular-season games; excludes special teams and practices.
- Recent playoff exposure
- Franchise playoff games in the three preceding seasons; does not imply the same players participated in all games.
- Offensive run share
- Prior-season carries divided by carries + pass attempts + sacks; includes scrambles and kneels and reflects game situation.
Higher roster percentiles mean more of that attribute, not better health.
Swipe to explore the full chart →
The nearest profiles do not necessarily share its injuries
The five nearest teams in the same season, ranked by distance across all six standardized attributes. Selected team appears first. 100 = that season’s NFL injury burden.
Swipe to explore the full chart →
View all 2024 profiles and distances
| Team | Group | Injury index | Age | Continuity | Top 22 share | Player snaps/game | Playoff games/3 years | Run share | Distance to selection |
|---|---|---|---|---|---|---|---|---|---|
| San Francisco 49ers | Established contenders | 183.5 | 27.33 | 82.5% | 73.5% | 1,396 | 9 | 48.7% | 0.000 |
| Buffalo Bills | Established contenders | 72.9 | 27.12 | 74.0% | 76.0% | 1,447 | 6 | 45.9% | 2.311 |
| Kansas City Chiefs | Established contenders | 91.5 | 26.19 | 75.2% | 71.6% | 1,435 | 10 | 38.6% | 3.284 |
| Cincinnati Bengals | Established contenders | 93.0 | 26.60 | 79.6% | 77.3% | 1,414 | 7 | 36.5% | 3.284 |
| Dallas Cowboys | Established contenders | 110.0 | 26.94 | 83.2% | 75.7% | 1,459 | 4 | 41.7% | 3.311 |
| Philadelphia Eagles | Established contenders | 43.8 | 27.44 | 73.4% | 73.3% | 1,494 | 5 | 45.9% | 3.413 |
| Tampa Bay Buccaneers | Established contenders | 98.5 | 26.26 | 67.1% | 77.2% | 1,442 | 5 | 41.9% | 3.677 |
| Los Angeles Rams | Established contenders | 118.0 | 26.65 | 67.8% | 77.1% | 1,477 | 5 | 43.6% | 3.699 |
| Miami Dolphins | Established contenders | 144.2 | 27.12 | 75.8% | 68.4% | 1,425 | 2 | 43.3% | 3.754 |
| Baltimore Ravens | Established contenders | 21.2 | 26.86 | 74.9% | 70.1% | 1,477 | 3 | 50.3% | 3.772 |
| Pittsburgh Steelers | Less established rosters | 99.9 | 26.96 | 59.0% | 70.1% | 1,423 | 2 | 47.3% | 4.055 |
| Detroit Lions | Established contenders | 125.5 | 26.02 | 70.8% | 74.9% | 1,469 | 3 | 44.0% | 4.314 |
| Jacksonville Jaguars | Established contenders | 74.4 | 26.62 | 83.7% | 73.9% | 1,474 | 2 | 40.7% | 4.327 |
| Denver Broncos | Established contenders | 59.6 | 27.25 | 69.0% | 74.9% | 1,425 | 0 | 44.4% | 4.362 |
| New England Patriots | Less established rosters | 121.1 | 27.04 | 72.9% | 66.5% | 1,416 | 1 | 40.7% | 4.544 |
| Las Vegas Raiders | Less established rosters | 154.4 | 26.94 | 56.5% | 74.7% | 1,410 | 1 | 40.9% | 4.706 |
| Green Bay Packers | Less established rosters | 59.9 | 25.48 | 72.8% | 68.7% | 1,428 | 3 | 41.9% | 4.775 |
| New Orleans Saints | Established contenders | 148.9 | 27.84 | 72.9% | 71.2% | 1,466 | 0 | 42.8% | 4.800 |
| Minnesota Vikings | Established contenders | 84.8 | 26.87 | 74.5% | 75.3% | 1,457 | 1 | 36.7% | 4.847 |
| New York Giants | Less established rosters | 91.3 | 25.76 | 68.0% | 68.3% | 1,444 | 2 | 43.0% | 4.918 |
| Seattle Seahawks | Less established rosters | 94.1 | 26.75 | 59.0% | 71.6% | 1,450 | 1 | 38.4% | 5.091 |
| Los Angeles Chargers | Established contenders | 83.4 | 26.48 | 79.4% | 72.8% | 1,495 | 1 | 39.0% | 5.158 |
| Tennessee Titans | Less established rosters | 90.7 | 26.58 | 49.0% | 68.2% | 1,424 | 1 | 44.3% | 5.285 |
| New York Jets | Less established rosters | 110.3 | 26.31 | 71.1% | 72.1% | 1,448 | 0 | 36.8% | 5.370 |
| Atlanta Falcons | Less established rosters | 57.4 | 26.70 | 53.0% | 72.0% | 1,468 | 0 | 47.8% | 5.378 |
| Carolina Panthers | Less established rosters | 149.4 | 26.74 | 53.2% | 70.1% | 1,426 | 0 | 40.6% | 5.403 |
| Cleveland Browns | Less established rosters | 138.5 | 26.73 | 63.1% | 65.6% | 1,490 | 1 | 43.6% | 5.445 |
| Chicago Bears | Less established rosters | 52.4 | 26.03 | 51.7% | 71.2% | 1,429 | 0 | 48.7% | 5.533 |
| Indianapolis Colts | Less established rosters | 116.7 | 26.04 | 70.5% | 73.7% | 1,501 | 0 | 43.8% | 5.617 |
| Washington Commanders | Less established rosters | 59.1 | 26.41 | 80.7% | 71.2% | 1,471 | 0 | 33.9% | 5.776 |
| Arizona Cardinals | Less established rosters | 136.0 | 26.00 | 50.3% | 64.4% | 1,450 | 1 | 44.1% | 6.066 |
| Houston Texans | Less established rosters | 115.5 | 26.97 | 42.1% | 63.9% | 1,471 | 2 | 41.0% | 6.244 |
The established group was, if anything, slightly healthier the following season: an average injury index of 97.2, versus 102.7 for the other group. The gap is small enough and uncertain enough that we should not treat either profile as a health advantage. It certainly does not identify an injury-prone class of veteran contenders.
SF’s closest same-year profiles entering 2024 were Buffalo, Kansas City, Cincinnati, Dallas and Philadelphia. Their injury indexes ranged from 43.8 to 110.0; SF’s was 183.5. No pair is a perfect match. Even so, their much healthier outcomes challenge the idea that a familiar veteran contender is destined to break down.
One surprise: SF had the league’s fewest regular-season offensive-plus-defensive player-snaps per game in 2023. Its postseason added exposure separately. A run-heavy identity did not automatically mean unusually high regular-season volume, and snap totals cannot reveal the intensity of each play.
The roster has lookalikes.
The injury burden is harder to reproduce.
Playing time and injury history offer clues—not a diagnosis.
So far, we have asked why entire teams lose availability over a season. A separate analysis zooms in on individual players: among those who played and were not currently on the physical injury report, who turns up on that report before the next regular-season game?
A prediction model learned from earlier seasons, then faced players’ results in 2024–2025 without having seen those outcomes. We tested which information it relied on most. and were the most useful clues. That is what the chart’s scores measure.
Predictive clues are not causes
Longer bars show which kinds of information helped the model predict another injury-report appearance. They do not show what caused injuries.
The score is the drop in after we scramble that information. Bigger drops mean more useful clues; they are not percentages of injuries explained.
Swipe to explore the full chart →
The model offers modest clues; it cannot explain San Francisco’s season-long injury burden. Select a bar to see what that information can—and cannot—tell us.
How prediction was checked
The model trained on 2017–2022, was selected using 2023, then was refit through 2023 and tested on 2024–2025. It predicts a new public physical-condition report before the next game among eligible active players, not a medical injury diagnosis or total time lost.
Its held-out AUC was 0.663; average precision (AP) was 0.151 versus a baseline of 0.091. These scores indicate modest predictive ability. The bars show AP percentage points: 100 × the change in average precision after related information is shuffled. A 2.79-point drop means 0.0279 on the 0–1 AP scale. Whiskers are conditional 95% intervals from resampling games; they omit some other uncertainty.
View the data
| Feature group | AP percentage points lost | Conditional 95% lower (pp) | Conditional 95% upper (pp) |
|---|---|---|---|
| Playing time in earlier games | 2.787 | 2.389 | 3.413 |
| Earlier injury reports | 2.609 | 1.855 | 3.131 |
| Schedule and recovery | 0.612 | 0.227 | 0.773 |
| Which team | 0.236 | -0.071 | 0.453 |
| Player position | 0.209 | 0.030 | 0.447 |
| Age | 0.015 | -0.128 | 0.084 |
| Home or away | 0.006 | -0.024 | 0.037 |
| Playing surface | -0.024 | -0.114 | 0.024 |
The model improves on guessing, but its predictions are modest. Most of the playing-time signal comes from how large a share of an earlier game a player took part in. That can reflect his role and opportunities to get hurt, as well as workload. Total snaps over the preceding month contributed much less—and SF’s eligible players did not average more of those snaps than the rest of the league.
There is a major blind spot: a player sent straight to injured reserve can vanish from subsequent public reports. Nick Bosa and Solomon Thomas in 2020, and Brandon Aiyuk in 2024, had no season-report rows in this dataset. The model also misses training-camp losses and players who never take the field. Those are precisely the kinds of losses that can wreck a season, so this model cannot explain the entire 49ers injury problem.
These clues concern the next game’s report. They do not establish what last year’s workload does to this year’s health. A prior-year running-back study actually found fewer next-season injury absences among the highest-carry group. That is compatible with selection of durable players, not proof that heavy usage protects them. Healthy players accumulate exposure; injured players lose the opportunity.
Do the injuries pile up after halftime?
If playing time is a useful clue, a natural follow-up is whether the 49ers get hurt unusually often late in games. First, a definition matters: “playing time in earlier games” means previous games in the same season. It does not mean snaps taken earlier that afternoon. The prediction model does not test fatigue building within a game.
To investigate that question separately, we searched nine seasons of play-by-play for : entries explicitly saying a named player “was injured during the play.” We counted the first such announcement for each player in each game and set overtime aside.
San Francisco does lean toward the second half—but less than the rest of the league. The split is 126 first-half announcements and 160 second-half announcements: 55.9% after halftime. For the other 31 teams, it is 59.1%. SF ranks 23rd among the 32 teams by second-half share. Fourth-quarter shares are almost identical: about 32% for SF and everybody else.
Do injury announcements pile up after halftime?
First explicit on-play injury announcement per player-game. These records capture a subset of injuries; overtime is counted separately.
Higher or lower describes when announcements occur, not which team is healthier.
Swipe the chart horizontally to see the full comparison →
View counts, uncertainty, and exclusions
| Group | Q1 | Q2 | Q3 | Q4 | First half | Second half | Second-half share | 95% interval | OT (separate) |
|---|---|---|---|---|---|---|---|---|---|
| San Francisco 49ers | 53 | 73 | 68 | 92 | 126 | 160 | 55.9% | 50.6%–61.3% | 1 |
| Other 31 franchises | 1,116 | 1,791 | 1,916 | 2,293 | 2,907 | 4,209 | 59.1% | 58.0%–60.3% | 51 |
Updates, nonspecific injury timeouts, and reports without an explicit player/team on-play clause are excluded. Practice and offseason injuries have no game-half assignment. Repeated announcements for the same player in a game are counted only at the first recorded occurrence. Filters are descriptive comparisons; viewing many teams or seasons is not a test of a preselected medical hypothesis.
The difference is small enough that we cannot confidently say SF has a different timing pattern. The reasonable range runs from roughly nine percentage points less second-half concentration to two points more. Adjusting for the number of recorded plays still does not reveal an unusually large second-half rise for SF.
Even the disastrous 2024 season does not fit the simple late-game story: just 13 of its 29 recorded announcements came after halftime. That is a small sample, and a few long absences matter far more to a season than their announcement count suggests.
There is also a hard limit to this test. Play-by-play is not a medical log. In 2024 alone, 119 player-game return announcements across the league had no matching initial injury announcement. Practices, delayed symptoms, quiet exits and some serious injuries are missing. Timing rules and recording habits can affect what gets written down.
Within the record we can observe, the predicted extra late-game skew is absent. That weakens this particular explanation of SF’s excess. It does not rule out fatigue, which can carry over between games or contribute to an injury before halftime.
What could explain the gap?
There is no shortage of theories about a team that keeps losing important players. The evidence supports some avenues of investigation more than others. It does not identify one culprit—or let us grade the 49ers’ training staff from the outside.
Injury history and recurrence
Supported mechanismHistory is predictive in our reporting model, and NFL hamstring research documents substantial recurrence. But repeated listings can describe one lingering condition rather than several new injuries. Medical histories and recovery timelines would be needed to identify a San Francisco-specific pattern. Recurrence study ↗
Preparation and practice load
Strong reason to investigateA 2026 league-wide study linked gradual or varied early practice schedules with a roughly 19% lower rate of lower-body strains during training camp. That makes preparation a credible avenue, but does not establish that the 49ers’ practices caused their injuries. Public game snaps cannot recreate practice-load data. Acclimation study ↗
Surface and movement demands
Injury-specific evidenceLeague medical-record research found a 16% higher lower-body injury rate per play on synthetic turf. That association is specific to the injuries and exposure studied. Low surface importance in our incomplete reporting model does not overturn it—and neither analysis attributes SF’s total excess to a field. Surface study ↗
Roster age, roles and retention
Plausible, insufficient explanationSF’s 2023 contributors were older and more continuous than most. Yet the comparable profiles did not generally reproduce SF’s 2024 burden. Age may matter for particular injuries; an older roster alone is not an adequate explanation. Personnel changes also break the link between last year’s team workload and this year’s players.
Short rest, travel and playoff miles
Mixed or inconclusive evidenceOur carryover estimates remain uncertain. Published NFL studies also do not support a simple blanket effect for short rest or travel. Absence of a clear association is not evidence of perfect recovery; these measures omit practice, symptoms and individual fatigue. Short-rest study ↗ · Travel study ↗
The affected positions also change. SF’s running backs accumulated 32.2 AGL in 2024, then only 0.4 in 2025, when edge rushers and receivers accounted for 55.6 combined. That moving pattern makes a single offensive-role explanation inadequate. 2024 breakdown · 2025 breakdown.
Chance and a few prolonged injuries can produce large swings. Repeated bad years make the question worth taking seriously, but a high rank cannot distinguish roster risk, preparation, rehabilitation, reporting habits and bad luck. Doing that would require medical diagnoses, contact mechanisms, practice exposure and player movement—information the public record does not consistently contain.
The strongest conclusion is also the most frustrating: the 49ers really have lost an unusual amount to injuries, and the obvious stories do not fully explain it. Their public reports offer leads—especially knees and calf/Achilles conditions. Their playoff history and roster profile offer context. Neither amounts to a verdict. Understanding why this keeps happening requires the individual injuries, exposures and recovery histories behind the totals.
Open the notebook
Methods, sources and what this analysis cannot tell us
Research cutoff: September 26, 2026. Completed injury outcomes: 2017–2025. Early 2026 is incomplete and is excluded from season rankings, carryover models and cluster outcomes. This analysis is descriptive and observational.
Metric glossary: what each term means
- Adjusted Games Lost (AGL)
- Football Outsiders / FTN’s estimate of injury-related availability lost by expected starters and important contributors during the regular season. Missed games add to the total; playing while listed as injured can add a fraction. It is not a count of diagnoses, and a star is not weighted more than another starter.
- Injury index
- A comparison scale: 100 is that season’s NFL average. A team at 140 has 40% more AGL than the league average; a team at 50 has half as much. Higher means more injury burden. It is not an individual player’s chance of getting hurt.
- Playing time in earlier games
- The model uses a player’s total snaps and offensive/defensive snap share in the last earlier game, plus snaps and games in the previous 28 days. All workload comes strictly before the game leading to the next report. Example: predicting a report before Week 8, with Week 7 as the current game, uses snap history before Week 7. Week 7 could already have been shortened by an injury. This does not measure first-half versus second-half workload, practices, collisions or prior-year fatigue.
- Earlier injury reports
- How often a player appeared on public physical-injury or condition reports in the preceding 28 and 365 days, plus time since the last report. Several weekly listings may all refer to one lingering injury; this is report history, not a tally of separate injuries.
- Player-snaps
- Participation summed across players. An ordinary offensive play with 11 players contributes about 11 offensive player-snaps. The team totals here add offensive and defensive participation. They do not measure distance run, collision force, practice work or actual fatigue.
- The uncertainty range
- A 95% confidence interval describes uncertainty in an estimated average or association under the model’s assumptions. It is not the range containing 95% of individual teams. When an estimated effect’s interval includes zero, these data do not clearly distinguish it from no association; a wide interval can still allow meaningful harm.
- Team profiles (clusters)
- Groups of team-seasons with similar age, continuity, playing-time concentration, volume, playoff history and rushing share. Injury outcomes were not used to form them. Their boundaries overlap, so they are descriptive summaries rather than distinct medical risk categories.
- Age weighted by playing time
- The average age of the players who actually played, with more influence given to those who took more offensive or defensive snaps. Age is measured on September 1 of the earlier season. It does not describe every player on the next season’s opening roster.
- Historical roster continuity
- The share of an earlier season’s snaps taken by players who also played for that club the year before. For the 2024 profile, SF’s 82.5% means 2023 snaps by players who also played for SF in 2022. It does not measure how many of those players returned for 2024.
- Concentration of playing time
- The share of a team’s offensive and defensive player-snaps taken by its 22 most-used players. A higher number means the core handled more of the work. It is not an overuse threshold; good health itself can allow a stable core to play more.
- Rushing share
- Carries divided by carries plus pass attempts plus sacks. It includes quarterback scrambles and kneel-downs, and reflects score and game situation. It is not a pure measure of designed runs or coaching philosophy.
- Predictive importance
- We shuffle one group of inputs and see how much the model’s predictions worsen on data it did not train on. A larger drop means that information helped this model more. It does not say what caused an injury, or what percentage of injuries a factor explains.
- Average precision (AP)
- A 0-to-1 score for how well a model brings positive cases toward the top of its predictions. Larger is better. Chart values show the change multiplied by 100: a loss of 2.8 AP percentage points means the AP score fell by 0.028. This is not a change in injury probability.
- Share of injury reports
- The proportion of public physical-injury/condition listings assigned to a body region. If a listing names two different regions, each gets half a unit. One persistent injury can appear in many weeks. Players sent directly to injured reserve may be missing entirely.
- A new reporting episode
- A player’s first observed listing for a body region, or a listing at least 28 days after the previous report in that region. This helps reduce repeated weekly listings, but it does not establish a new medical injury or confirmed recovery.
- Timed injury announcements
- The first play-by-play announcement per player per game explicitly stating that he was injured during the play, assigned to the quarter of that play. Return-to-game updates are excluded. This captures visible game announcements, not every injury or the full medical record.
The injury benchmark: 288 team-seasons
Injury index = 100 × a team’s AGL divided by that season’s 32-team mean. Era rankings equally weight nine annual indexes. Franchise relocations are unified. AGL covers the regular season, not postseason losses, and reflects the publisher’s judgments about contributor eligibility; it is not talent-weighted clinical incidence.
We compiled successive FO/FTN public releases, using revised comparison columns where available. The 2017 table is an older vintage that cannot be fully restated from recovered sources. These are not all historical seasons rerun under one latest algorithm. Year normalization reduces scale differences but cannot eliminate methodology changes.
Direct COVID absences are excluded in 2020–2021. Pandemic changes to preparation, scheduling and reporting can still matter. The 2022 AGL source counts the cancelled Buffalo–Cincinnati game from report/IR status; workload counts only played games. Excluding pandemic years and excluding 2017 leave SF near the top. The conventional outlier check uses the 32 franchise means and the upper quartile + 1.5 interquartile ranges.
Injury types: report composition, not clinical incidence
We classify all four primary/secondary injury and practice-report fields into 11 body-region/condition categories. Each physical player-game listing contributes one unit divided equally across distinct categories; repeated weekly listings remain separate observations. Illness, rest and administrative-only listings are excluded. Concussion-related includes protocol/evaluation language and is not necessarily a confirmed concussion.
The sample includes 41,531 physical listings, including 1,354 for SF, across 2017–2025. The other-31 comparison is standardized to the selected team’s season-by-broad-position distribution among its physical reports. This is composition conditional on being listed, not risk per player or per snap. Report coverage is present for 4,759 of 4,766 completed team-games, including every SF game.
Full-era SF uncertainty uses 4,000 bootstrap replicates of SF player trajectories and other-team franchise histories, recomputing standardization each time. Displayed difference intervals cover the 11-category family approximately simultaneously. None excludes zero; the exploratory global maximum-statistic p-value is .0895. This is conditional on a team and window selected after observing its history, and shared calendar shocks and player movement are not fully captured. Other team/year filters show descriptive estimates without intervals.
Checks add age bands, exclude 2020–2021, restrict to 2022–2025 or Out/Doubtful listings, and reduce repeats with first-region/player-season or a . Direct-to-IR cases can be absent. Report location does not identify tissue damage, mechanism or severity; calf/Achilles is not a count of Achilles ruptures. The classification audit and sensitivity tables are in the downloads.
Playoff carryover: 256 transitions and uncertainty
Exposure seasons are 2017–2024; outcome seasons are 2018–2025. Primary regression: following-season injury index on prior playoff games, prior injury index, prior regular-season win percentage, prior regular-season snap-weighted age, and outcome-year fixed effects. Super Bowl appearance and total player-snaps replace playoff games in separate models. Snaps sum offense plus defense and include the postseason; special teams and practice load are omitted.
Reported intervals use franchise-clustered standard errors, finite-sample corrections and Student-t critical values with 31 degrees of freedom. Restricted wild-cluster bootstrap checks use 9,999 draws. For prior playoff games, p=.315 (wild-bootstrap p=.324); for total volume, p=.940; for a Super Bowl appearance, p=.367. These p-values do not establish absence of harm.
We checked raw AGL, added team effects, removed SF, excluded pandemic outcomes or transitions, and split the playoff-expansion eras. Main full-sample conclusions are inconclusive. The small pre-expansion subset alone is borderline positive (p=.047), whereas the expanded-era subset is not (p=.877). Those exploratory, uncorrected checks show instability rather than a selected positive conclusion. Team effects with a lagged outcome in a short panel can introduce bias; that version is a sensitivity.
Prior health and wins help explain playoff selection but cannot randomize it. Team totals do not follow the same returning players, measure meaningful-game intensity, or observe actual offseason recovery. The 16 Super Bowl follow-ups involve seven franchises. Three-year playoff measures use 2015–2016 schedules for initial lookback windows.
Clustering: overlapping profiles, not injury classes
All 256 profiles use completed pre-outcome information. Six features are standardized across the pooled sample. K-means uses 100 starts; k=2 through k=6 are compared using silhouette without inspecting the injury outcome. The best score is 0.181 at k=2. Median franchise-bootstrap adjusted Rand agreement is 0.597; Ward clustering agreement is only 0.217. Algorithm and feature choices materially affect membership.
Age is weighted by regular-season offensive/defensive snaps and measured September 1 of the feature year. Historical continuity is the share of those snaps from players who also played for the same club in the preceding year: SF’s 82.5% entering-2024 value means 2023 snaps by players also on the field for SF in 2022. It does not measure 2023-to-2024 retention. Top-22 concentration is partly influenced by previous injuries.
Rushing share is carries / (carries + attempts + sacks), including scrambles and kneels. Volume is scrimmage player-snaps per regular-season game. Playoff history covers three prior seasons. The two-dimensional PCA chart preserves 53.4% of feature variation. Nearest peers are selected using all six standardized features, not their apparent distance on the map.
Outcome intervals resample franchises 5,000 times and condition on the displayed cluster labels. They do not include uncertainty from choosing and fitting the clusters. SF entering 2024 retains its broad assignment in all 500 matched-label resamples; that stability is not a prediction of its injuries. Descriptive grouping labels do not apply identically to every member.
The prediction model and feature importance
The unit is a participating player’s transition to the next scheduled team regular-season game. Eligibility requires positive index-game snaps, no current physical injury/condition listing, and public-report coverage for both team-games. The target is a new physical injury/condition report before the next game. Illness, rest and explicit non-injury reasons are excluded. A new listing is not necessarily new tissue damage.
Two fixed candidates—logistic regression and histogram gradient boosting—train on 2017–2022. 2023 average precision selects gradient boosting; it is refit through 2023 and tested once on 2024–2025. Held-out n=41,858 with 3,795 positive appearances. AUC=.663, average precision=.151, Brier=.0802 versus .0824 for a constant-probability baseline.
Earlier-workload predictors exclude the index game itself, which could be shortened by injury. Prior report weeks can represent continuing conditions. Grouped permutation importance measures test average-precision loss after scrambling related columns. Bands are approximate game-cluster bootstrap intervals conditional on the fitted model and a fixed permutation; they omit training uncertainty and some repeated-player/team dependence. Correlated groups can substitute for each other or create unrealistic shuffled combinations. These scores are not additive causal shares.
Direct-to-IR cases, nonparticipants, camp injuries and off-roster outcomes can be missed. The outcome differs from AGL and cannot establish which feature explains SF’s total excess. Surface and schedule associations cannot reliably identify the time or place an injury occurred. Do not interpret low importance as refuting diagnosis-specific medical studies.
Game timing: a conservative play-by-play proxy
We parse 2017–2025 regular-season nflverse play-by-play descriptions for the explicit named-player phrase “was injured during the play.” Team attribution comes from that player’s team token, not possession. Multiple injured players on a play are retained, duplicate player/play mentions are removed, and the primary endpoint takes the first announcement per player-game. Quarter belongs to the play; return updates and nonspecific injury timeouts are excluded.
The extraction finds 7,454 first player-game announcements across 2,383 games. Regulation includes 286 SF and 7,116 other-team announcements; 52 overtime announcements (one SF) are excluded from half shares. First half is quarters 1–2; second half is quarters 3–4. The SF-minus-other second-half difference is −3.20 percentage points, with a 95% game-bootstrap interval of −8.69 to +2.20. The ratio of second/first-half announcement rates, SF relative to others, is .876 (95% interval .704–1.093).
Rates use 1,000 recorded team game-play opportunities, counting offense, defense and special-teams plays once per team in the game; eligible penalty/no-play records are included. They are not individual athlete-exposure rates. The bootstrap resamples whole games within season and SF-involvement strata 10,000 times, keeping SF opponents together. It does not fully model repeated players or changing recording practices. Sensitivities retain later announcements, restrict to scrimmage plays, remove each half’s final two minutes and split the era; none produces a larger SF second-half skew.
All 7,662 standardized source phrases matched the parser. An independent nearest-team/jersey check found no attribution mismatches; 72 seeded examples, spaced names and ambiguous nonstandard entries were audited. Missingness is demonstrable: in 2024, 119 of 609 player-games with return updates lacked any initial announcement. Public timestamps are not a complete injury-onset record, and this cannot decompose AGL or estimate injury severity. Selected source columns, extraction audits, hashes and reproduction scripts are included.
Primary sources and reproducibility
The downloads include row-level source URLs, input hashes, definitions, model coefficients, uncertainty and analysis scripts. Headline regressions, clustering summaries and held-out performance were independently recalculated before publication.
- FTN: 2025 AGL and revised 2024 comparison
- FTN: 2024 AGL and revised 2023 comparison
- FTN: 2023 AGL and revised 2022 comparison
- FO: COVID-excluded 2021 comparison
- FO: 2020, without COVID
- FO: 2019 and revised 2018
- FO: original 2017 AGL
- nflverse / PFR snap counts
- nflverse schedules
- nflverse injury reports
- nflverse play-by-play descriptions and clocks
- nflverse birth-date records
- nflverse team statistics
- Team marks: ESPN’s team-logo assets, identified through nflverse team metadata. Current franchise marks are used across historical seasons for consistent identification.